Phobrain
Image Analysis 3 - Distances in Poincare Spherical Space
Paper: Poincaré Embeddings for Learning Hierarchical Representations
Project (not looked at yet; used Java):
Implementation: Poincaré Embeddings for Learning Hierarchical Representations
Earlier image distance analysis.
Results for various image histogram methods applied
to a sampling of 328 photos with '11' in their sequence number,
from a collection of 8K photos by Bill and Elle,
and a sampling of 568 photos with '33' in their sequence number
from 16K
photos, including photos from Ellen and Raf & Skot as well.
Units are scaled to give a reasonable integer range.
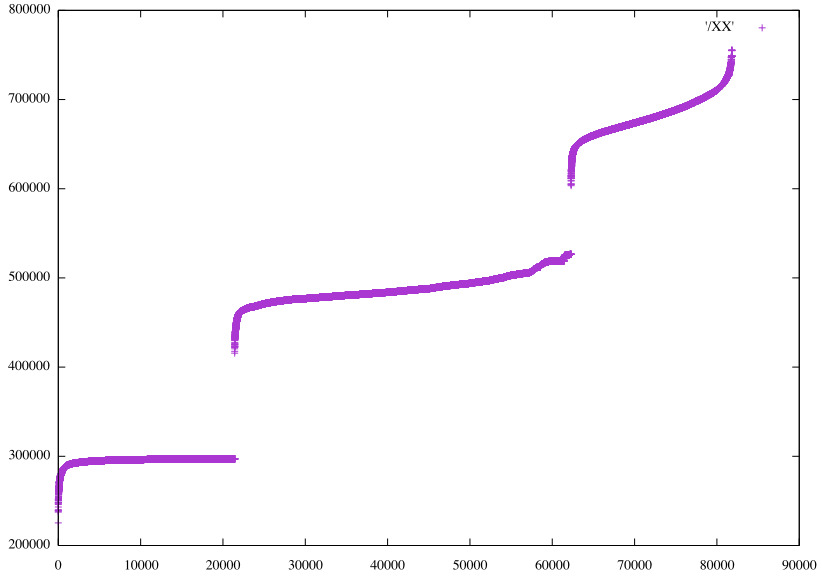
Pair distances stratify into three groups in each case. In the two extreme
cases examined, Greyscale and RGB 32^3,
all the photos in the sample are found in
the central Group 2 layer of pairs, while Groups 1 and 3 have fewer unique
photos and pairs, and there is a disjoint split of all photos
between Groups 1 and 3.
This holds for both samples.
Photo/Pair counts per Group
| Metric | N Photos | Group 1 | Group 2 | Group 3 |
|---|---|---|---|---|
| Greyscale | 328 | 189/9142 | 328/13538 | 139/4893 |
| RGB 32^3 | 328 | 167/7231 | 328/13832 | 161/6510 |
| Greyscale | 568 | 336/28456 | 568/39696 | 232/13664 |
| RGB 32^3 | 568 | 293/21426 | 568/40865 | 275/19525 |
Groups 1 & 3: Intersections between Greyscale and RGB 32^3 (photos/aggregate)
| N Photos | Group 1 | Group 3 |
|---|---|---|
| 328 | 107/249 | 79/221 |
| 568 | 175/454 | 114/393 |
Intersection of Pairs between Greyscale/RGB32 Groups (pairs/aggregate)
| N Photos | Group 1 | Group 2 | Group 3 |
|---|---|---|---|
| 328 | 217/13324 | 457/20408 | 150/9810 |
| 568 | 2061/42271 | 12193/60797 | 1565/29801 |
Sorted picture-picture distances
Greyscale
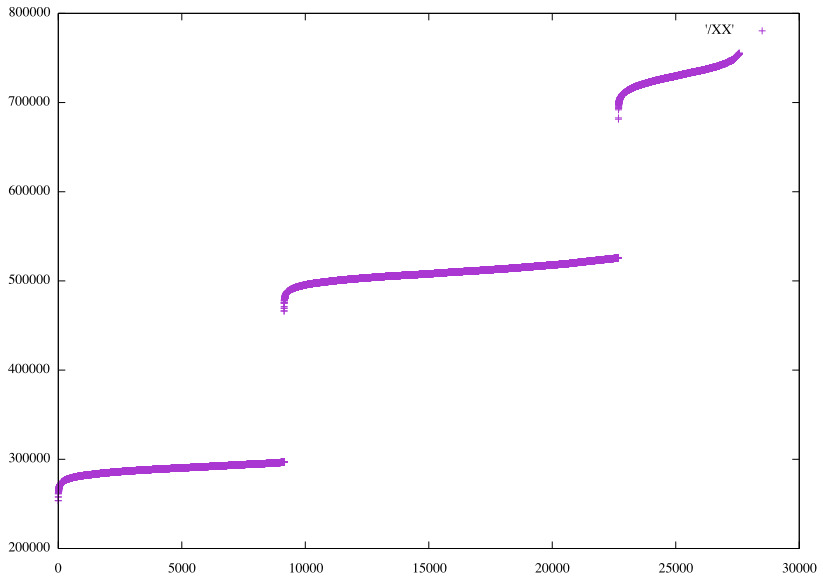
Hue*Saturation 24x24
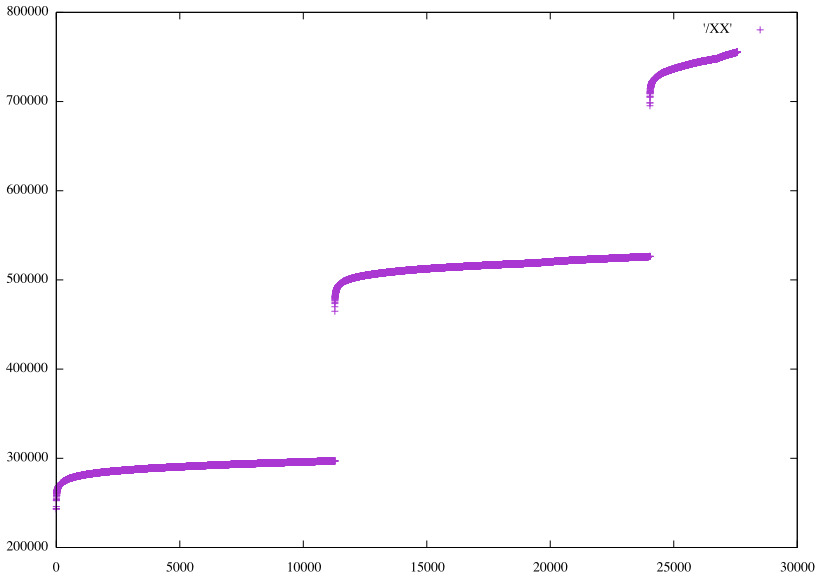
Hue*Saturation 48x48
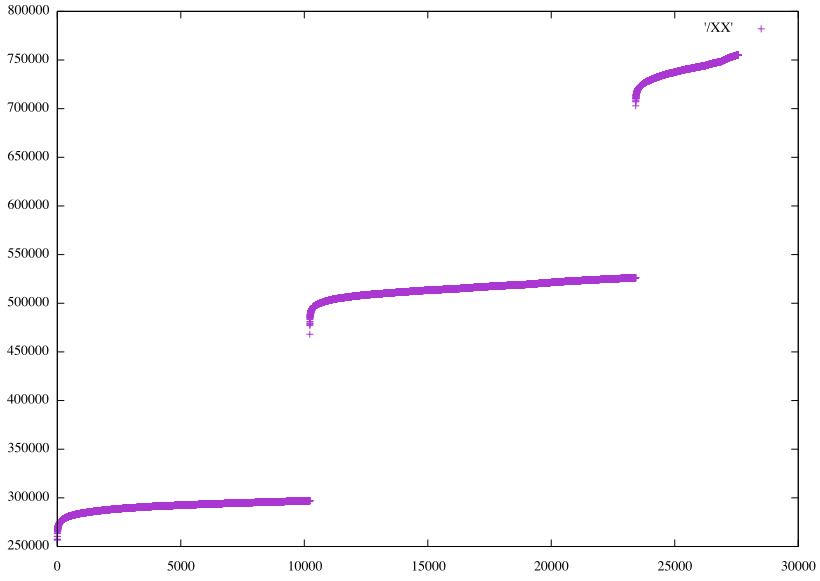
RGB 12x12x12
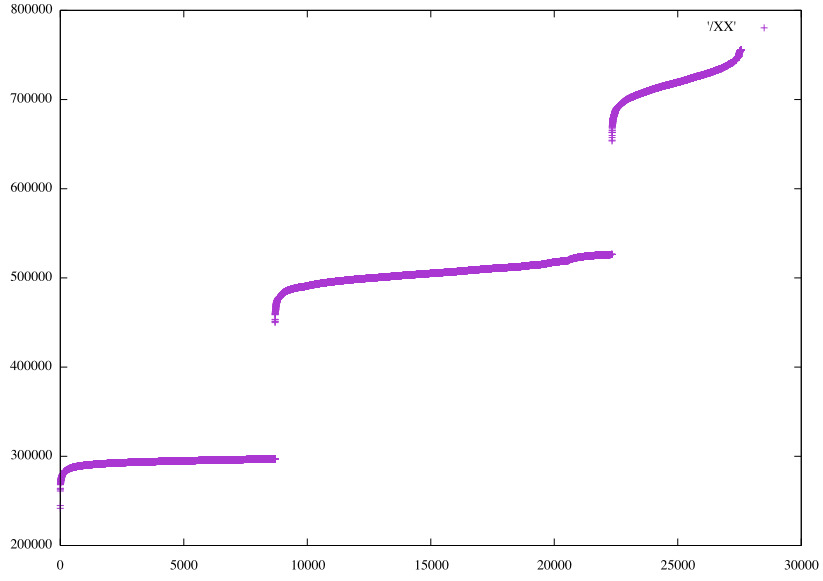
RGB 24x24x24
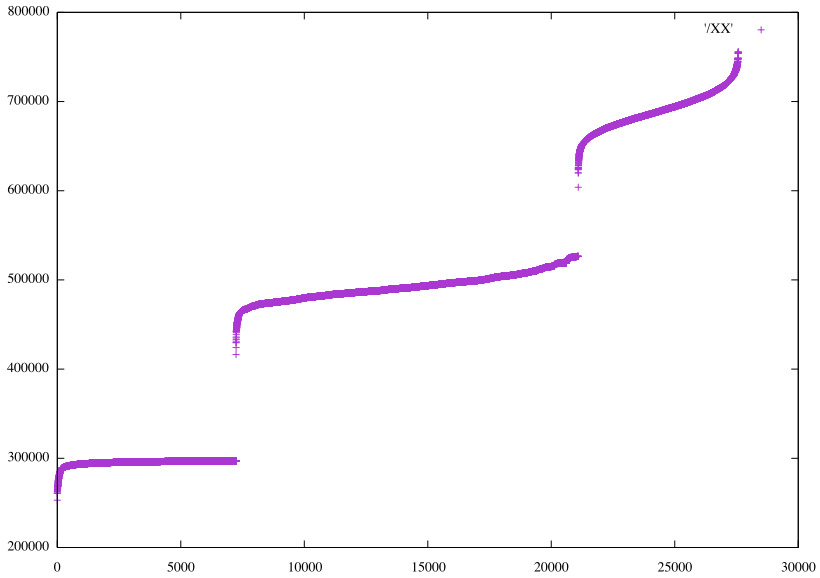
RGB 32x32x32
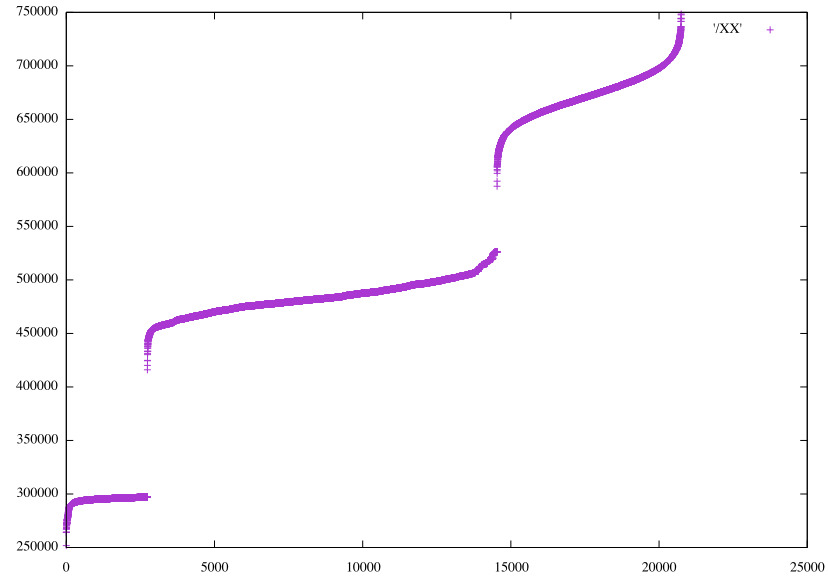
Sample size 568 photos from 16K
With '33' in sequence number.
Greyscale
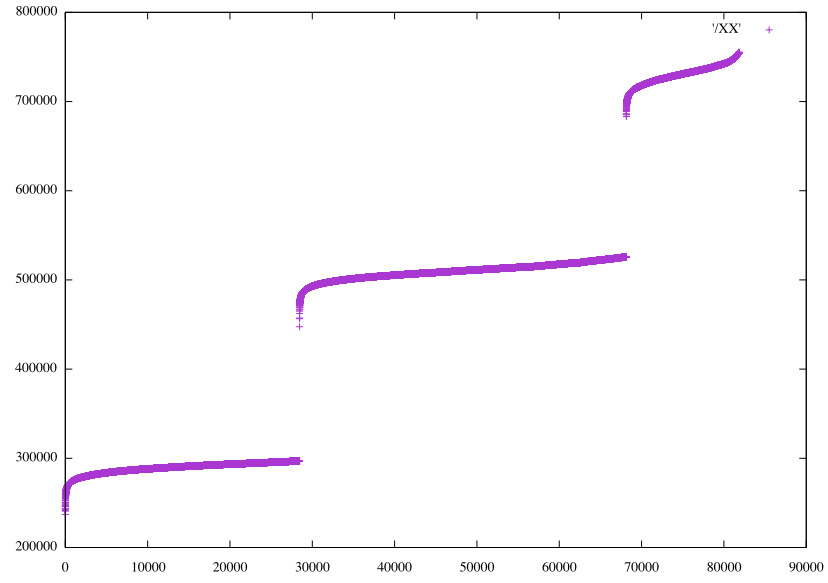
RGB 32x32x32
Numerical differences due to color profiles, and distributions
There are significant numerical diffs between Oracle and
OpenJDK for a lot of pairs' distance calculations, due to different
default color profiles used.
These diffs don't affect the overall
distributions, but they can affect which Group an individual pair falls into..
OpenJDK vs. Oracle:
< 1:1 1:499 513731
> 1:1 1:499 513732

< 1:1 1:776 505618
> 1:1 1:776 505599

< 1:1 1:793 505533
> 1:1 1:793 723759

< 1:1 1:1690 722604
> 1:1 1:1690 509486

< 1:1 1:1869 735261
> 1:1 1:1869 517035
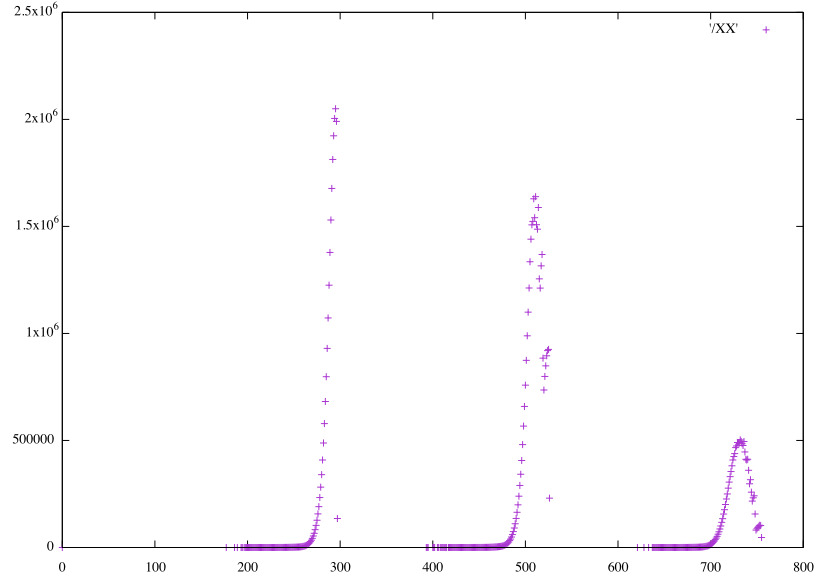
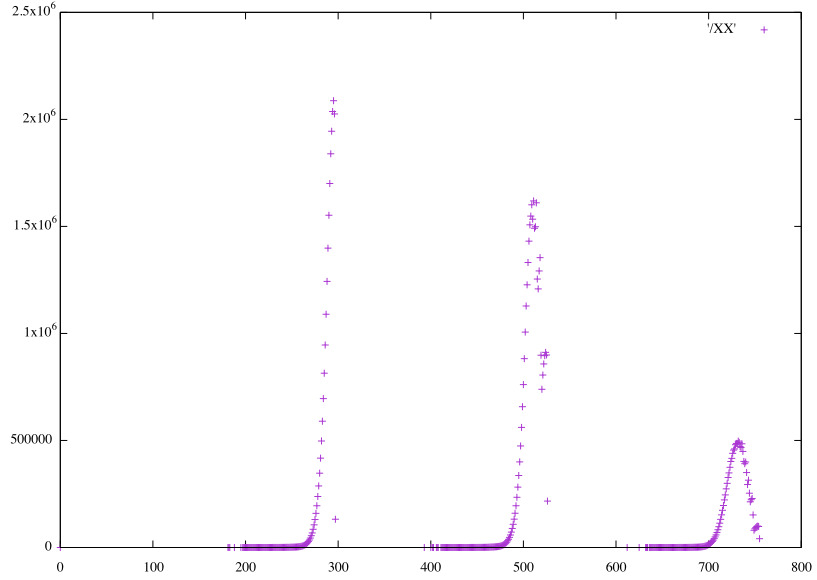
Overall greyscale distributions for ~118M pairs are the same for the two JDK's:
Oracle Greyscale distribution
OpenJDK Greyscale distribution
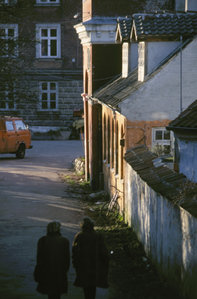
For some images, ImageIO.read() returns e.g. 673/58903 differing bytes, including these from a stretch of about 100 pixels:
< -9876933
> -9942469

< -9876931
> -9942467

< -4279385
> -4344921
Here is the image:
Software
Histograms from BoofCV.
What use to cry for Capricorn? it sails
Across the heart's red atlas: it is found
Only within the ribs, where all the tails
The tempest has are whisking it around.
— Mervyn Peake, Titus Alone